How to route different metrics in Telegraf to different Influx databases
Written: 2020-01-04
Tags
Category

So, at the beginning of the last couple of years I have dropped my Influx Telegraf database containing all the host metrics gathered from the previous year. I did this because it was getting too big, and my container appdata backups where getting too big and taking too long to backup. Yes I know I could have just set a retention policy on the database and have it cleared every week, but I wanted some long term metrics like disk usage, so I could see the growth over the year.
My Influxdb container appdata folder is currently 40GB so lets fix that.
Creating the long term database
Log into your Influxdb instance. If you use docker you can exec in like so: docker exec -it Influxdb influx where Influxdb is the name of the container.
Create the database with the following command: CREATE DATABASE longterm_metrics This creates the database longterm_metrics without any retention policy. If you want a retention policy on the long term metrics, say for example 1 year, you can run this:
CREATE DATABASE longterm_metrics WITH DURATION 365d REPLICATION 1 SHARD DURATION 1w NAME RP_longterm_365d
This will create the database and set the 365d retention policy to default for that database. If you want you can read more about replication and shards here: https://docs.influxdata.com/influxdb/v1.7/concepts/glossary/#replication-factor and https://docs.influxdata.com/influxdb/v1.7/concepts/glossary/#shard
You can also look up retention policies with the show retention policies command. First select which database to use with the use <database> command and then run the show retention policies command like so:
> use longterm_metrics
Using database longterm_metrics
> show retention policies
name             duration  shardGroupDuration replicaN default
---- -------- ------------------ -------- -------
RP_longterm_365d 8760h0m0s 168h0m0s           1        true
>
Adding a new default retention policy on the Telegraf database
Run the following command to create a new default retention policy on the telegraf database:
Danger
This will ''reset'' the whole database!
The data won't be gone, it's still accessible using the autogen retention policy. But the command below sets the new one as default, and that's what the panels normally use in Grafana.
If you want to migrate some data after you can check out this post https://community.influxdata.com/t/applying-retention-policies-to-existing-measurments/802/2
CREATE RETENTION POLICY "7_day_retention" ON "telegraf" DURATION 1w REPLICATION 1 SHARD DURATION 1w DEFAULT
This will create the retention policy called 7_day_retention and set it as the default policy.
After I set the new default retention policy my Influxdb appdata folder went from 40GB to 225MB :)
Read more here: https://docs.influxdata.com/influxdb/v1.7/query_language/database_management/#retention-policy-management
Sending the metrics to a different database
Now in Telegraf we simply need to add an extra output that tells Telegraf to also route the metrics we want to another database.
Note
This won't stop telegraf from writing the metrics to the OG telegraf database, it will write to both
Add the following to the telegraf.conf file. Note add, not replace.
[[outputs.influxdb]]
  urls = ["http://192.168.1.34:8086"] # required
  database = "longterm_metrics" # required
  retention_policy = ""
  write_consistency = "any"
  timeout = "5s"
  namepass = ["apcupsd","disk","diskio"]
As I didn't add a retention policy for my long term database I have set it to use an empty string as that will use the default retention policy (autogen) of that database. If you first created the database, and then added a retention policy to that database that you want to use, you must set retention_policy = "<retention_policy>" to the retention policy you want. If not it will use the autogen retention policy as that is set to default when just running create <database>
The namepass = ["apcupsd","disk","diskio"] is what tells Telegraf which metrics to send to that specific database.
After you've added the lines restart Telegraf.
Adding a new datasource in Grafana
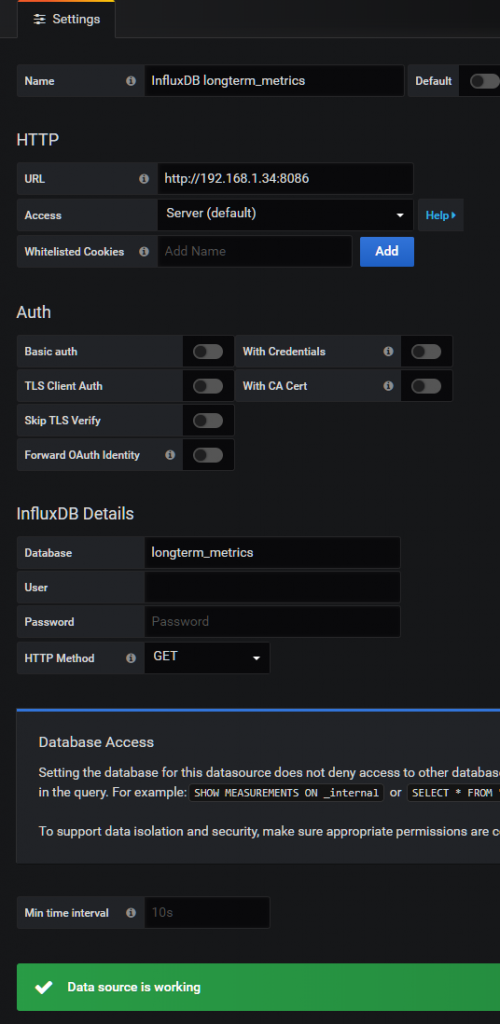
Since my Telegraf datasource uses the telegraf database, we need to add a new data source that uses our new database.
Click on Add data source and select InfluxDB.
Next give the data source a name, add the URL to InfluxDB, set the database to use the new database you created and click Save & Test
Updating the Grafana panels
Next it's just a matter of updating the Grafana panels to use the new data source.
If you use my Unraid System Dashboard https://grafana.com/grafana/dashboards/7233 you can just download the latest version and select the disk data source in the drop down. 
Sources:
https://docs.influxdata.com/influxdb/v1.7/query_language/database_management
https://docs.influxdata.com/telegraf/v1.13/administration/configuration/


