Monitoring your UPS stats and cost with InfluxDB and Grafana on Unraid – NUT Edition
Written: 2019-09-25
Tags
Category

This quick guide will explain how to setup Grafana and InfluxDB to monitor your UPS power usage using the NUT plugin and maihai/nut-influxdb-exporter docker container on Unraid. This pretty much just a rewrite of this article but for the NUT plugin.
Grafana
If you haven't installed or used Grafana and InfluxDB, I recommend reading this post first. You can skip the Telegraf part but that's no fun :)
InfluxDB
Dont' use the latest tag
The :latest tag will run InfluxDB V2! This guide was written for v1.8. Change the tag to :1.8.x for it to work!

Installing the container
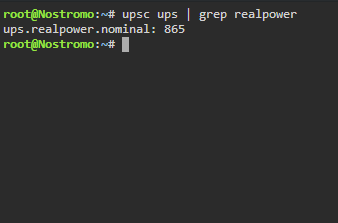
Search for nut influx exporterin CA and click install. Fill out the different container variables to match your setup. Remember to click on Show more settings... to see the rest of the variables. If your UPS reports the WATTS/Nominal Powermetric you can remove this variable. You can see if it reports it by going to the dashboard and look at the stats or run the upsc ups command.

The INFLUXDB_HOST and NUT_HOST will most likely be your Unraid IP and INFLUXDB_PORT is the port for your InfluxDB http service. Default it will be 8086. You can leave user and password blank if you don't have a specific user you want to use in your InfluxDB instance. And the same for the NUT port, username and password.
The database will be created at the launch of the container, so you don't need to create it manually.
The default interval is set to 20 seconds, and if I recall correctly that is the max for NUT. I tried setting it to 10 seconds using the INTERVAL variable but when I did that it reported the same metric twice all the time.

UPS Dashboard
After you have installed the apcupsd container add the datasource in Grafana and use the database name you chose above.
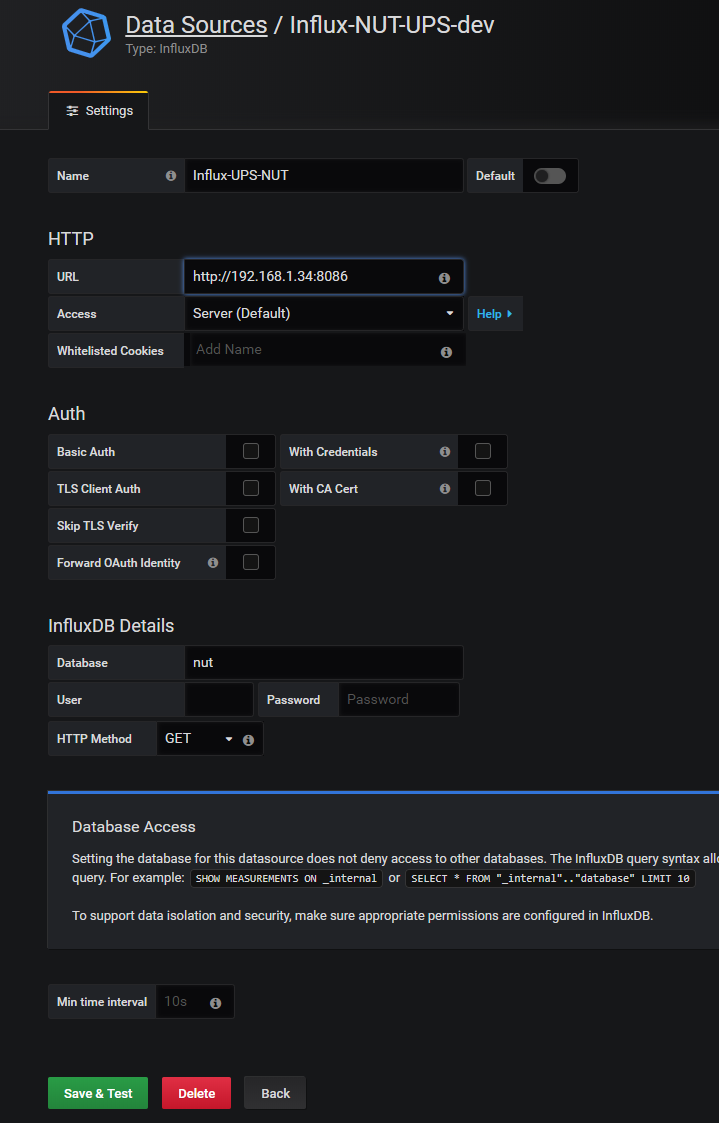
Next import my new UPS dashboard and select the correct datasource in the drop down menu at the top. Link to dashboard: https://grafana.com/grafana/dashboards/10914

And that's it! Enjoy your new and improved UPS stats!

The custom theme for Grafana can be found here: https://github.com/gilbN/theme.park
